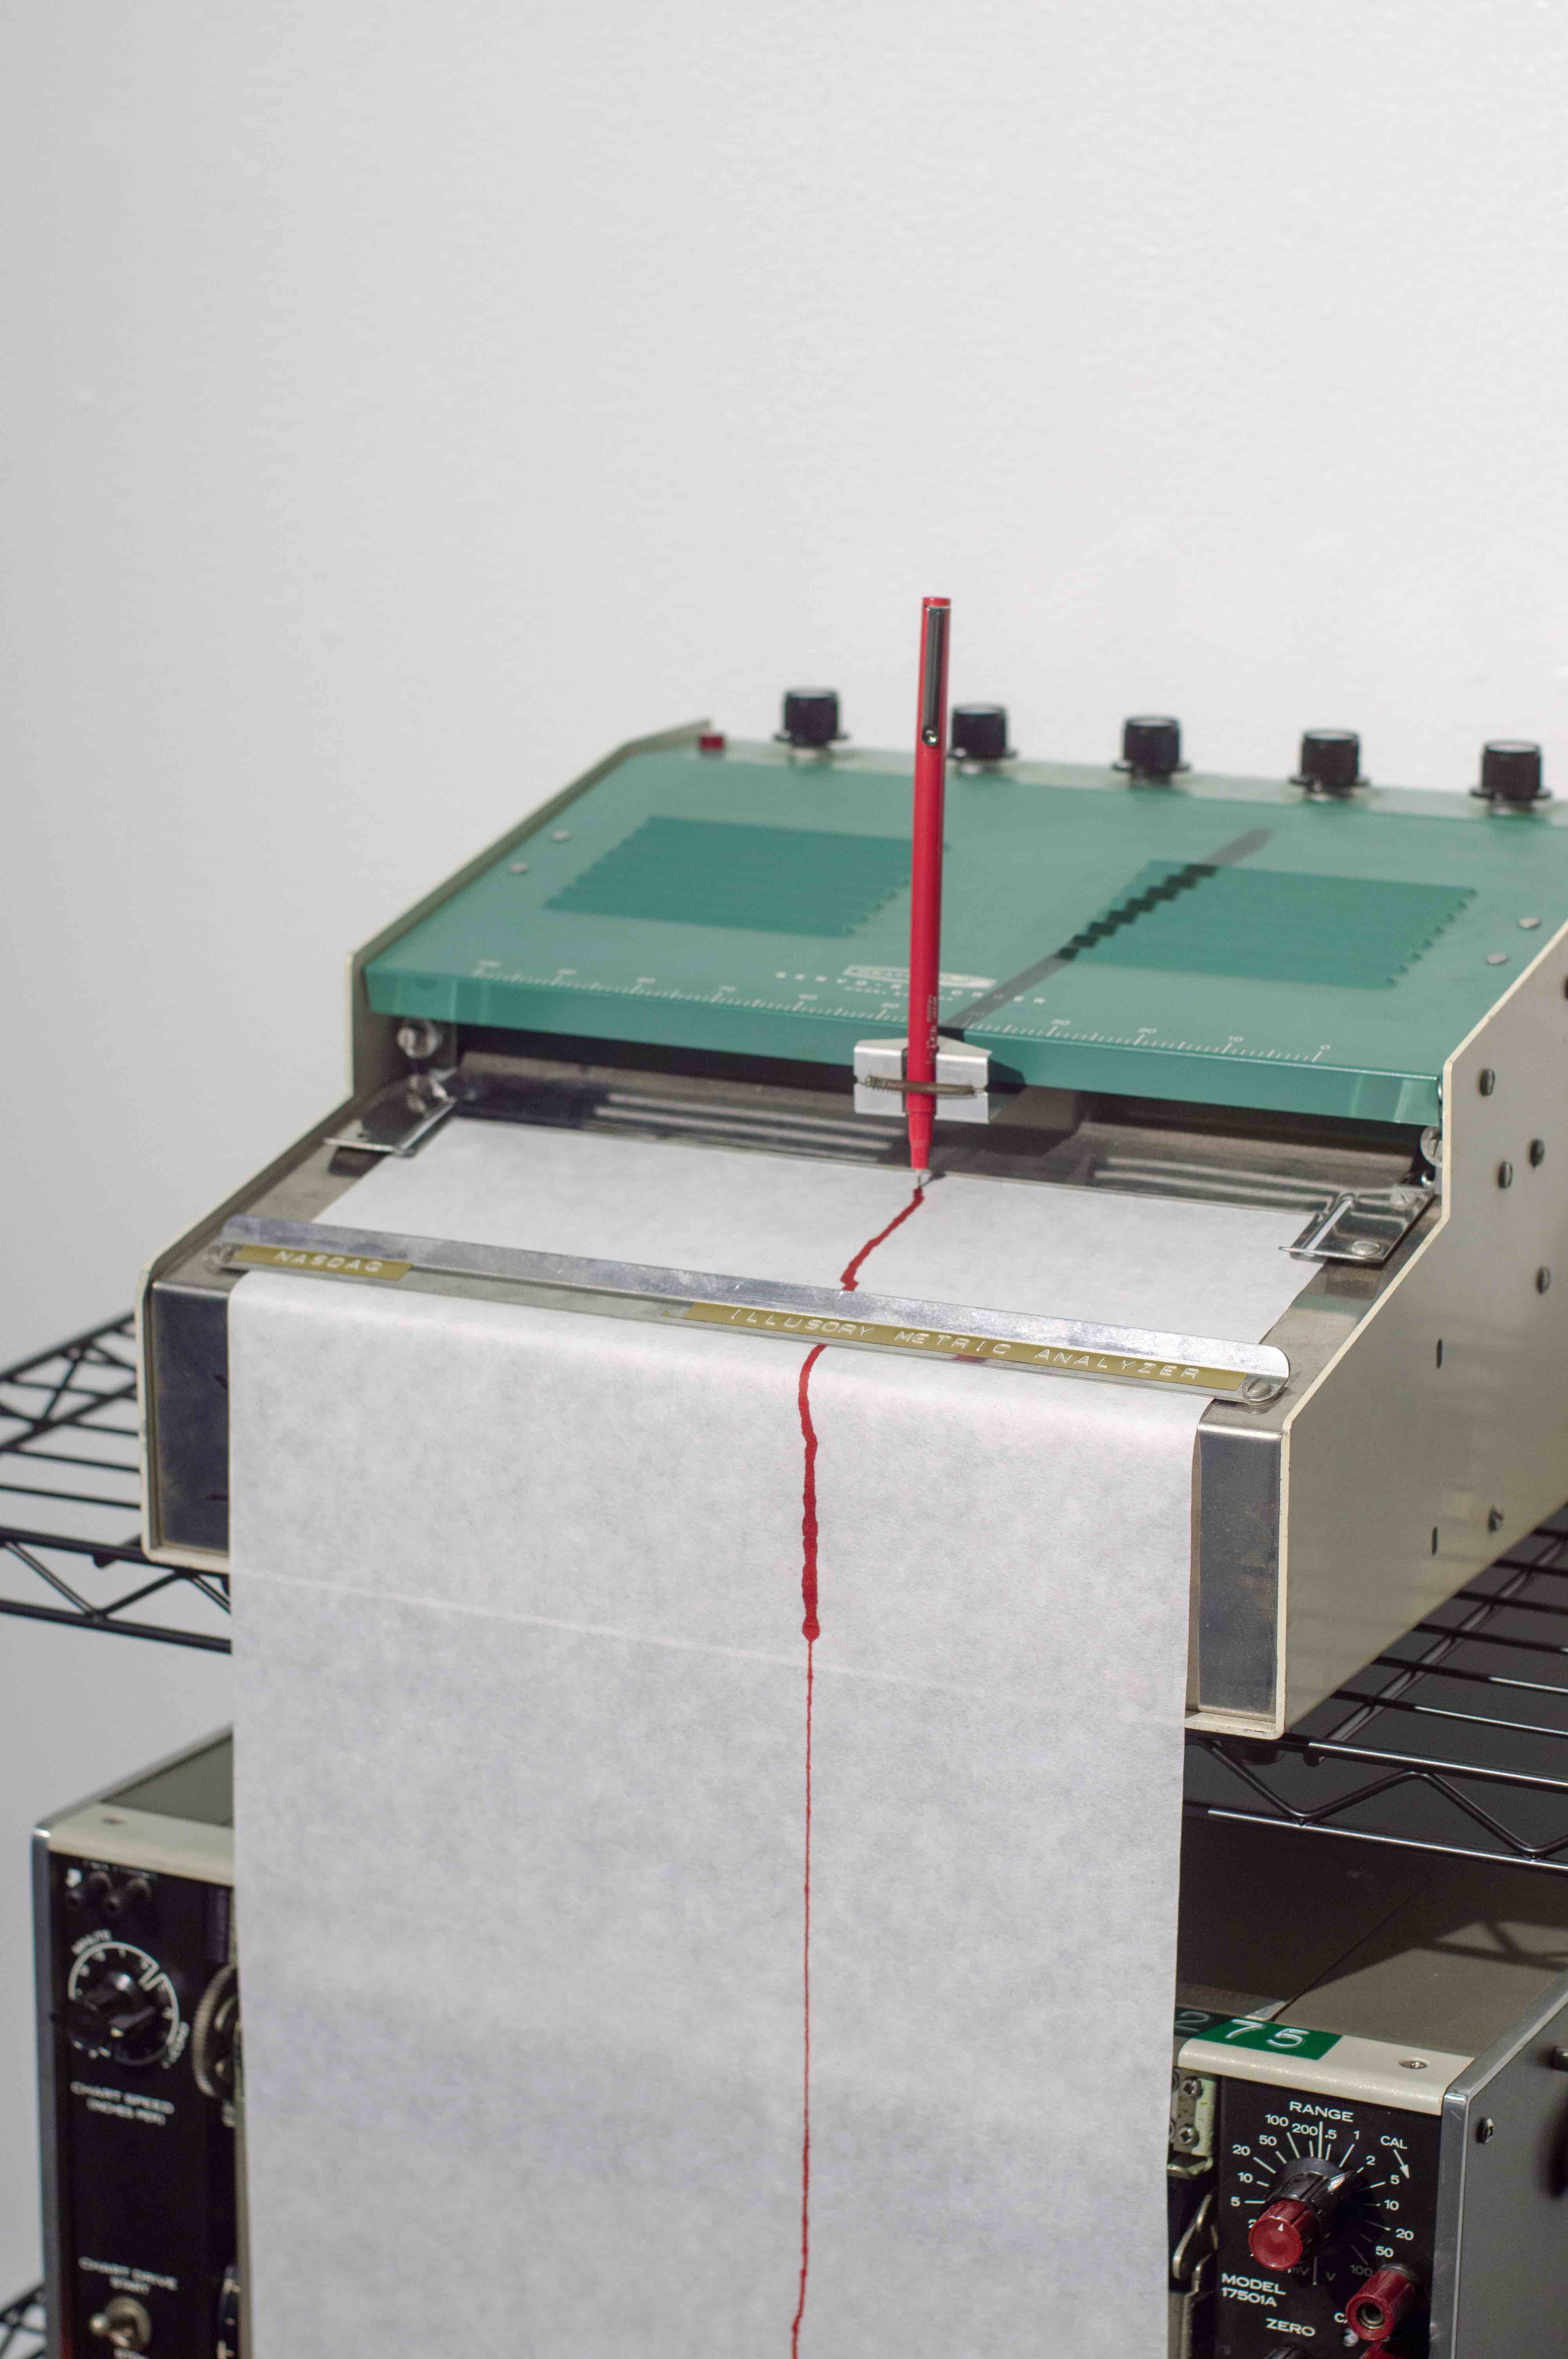
Illusory Metric Analyzer
Vintage Chart Recorders, Arduino, Raspberry Pi
2019
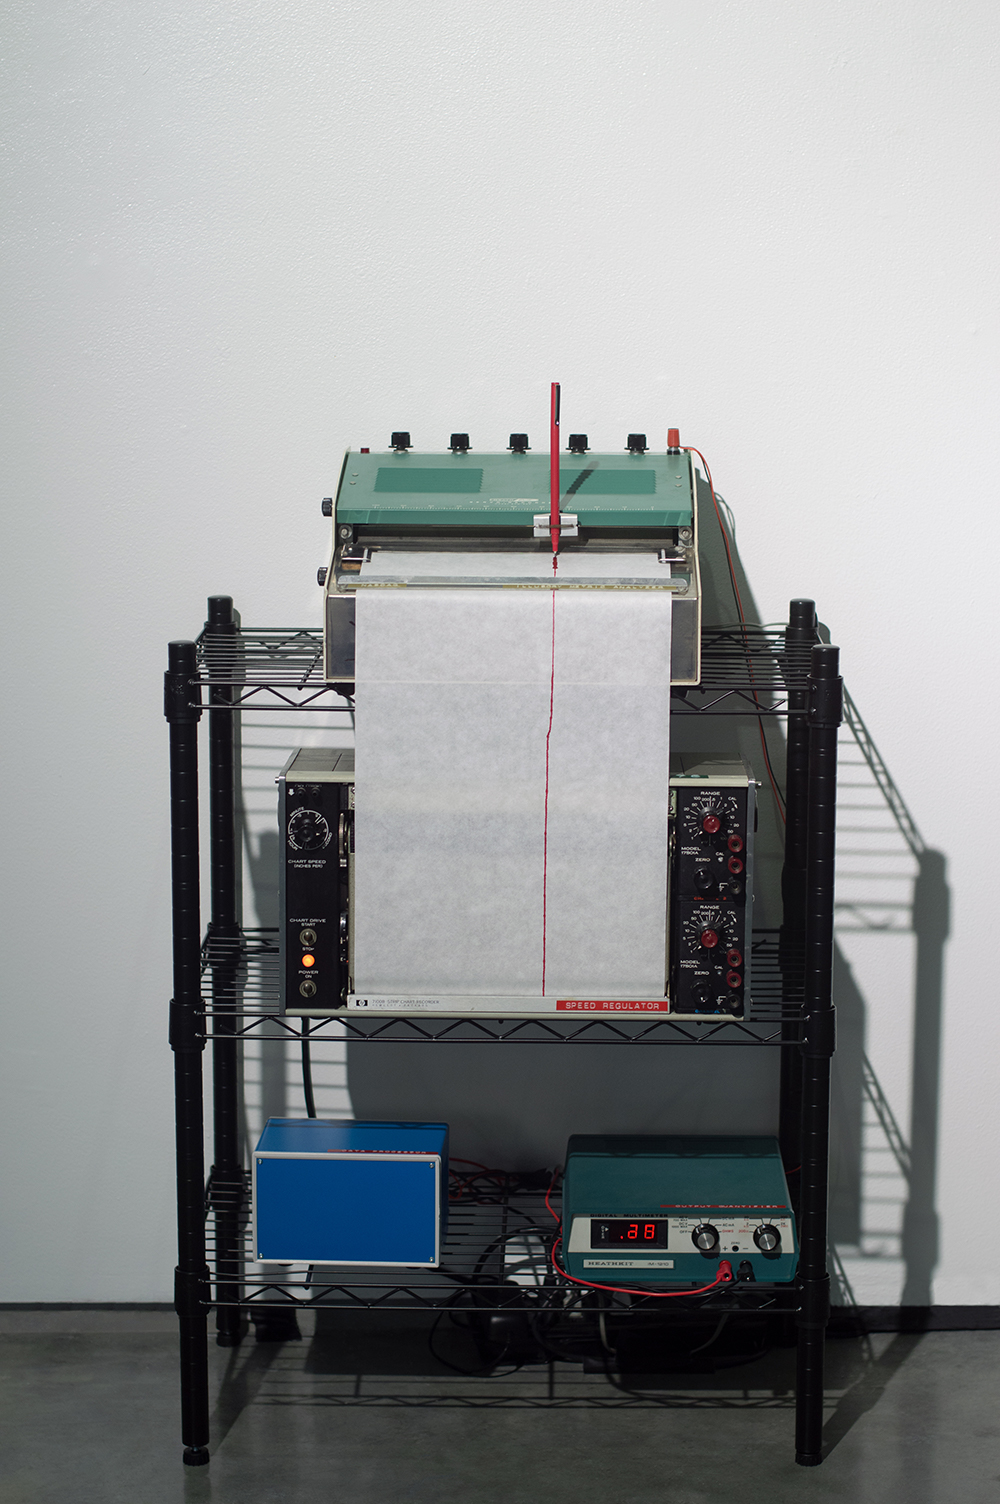
Illusory Metric Analyzer is an installation consisting of modified vintage industrial chart recorders which plot the value of the NASDAQ index. The project was born out of research into the excesses of the stock markets in the 21st century, including the implementation of algorithmic and high-frequency trading. The equipment’s struggle to keep up with the day’s trading volume mirrors the relationship of the market and governing bodies.
There is no discernible way of interpreting the data on the resulting paper chart produced by the machines. No markings, scales or legends are provided to define how well the market is doing (or for that matter, what data is being recorded), calling into question the relevance of the market data for the daily lives of most people.
The piece was created using two vintage chart recorders connected to an Arduino, which was fed data from a Raspberry Pi. The chart recorders were restored to functional condition and modified to work in tandem, allowing for more of the chart to be visible at once. The voltage controlling the chart recorder was also connected to a multimeter of similar vintage, supplying an additional illegible data point. Chart data was acquired from the Yahoo Finance API.